
Frequency Sweep
Here we simulate the frequency response of an RC circuit in PSPICE by sweeping through frequency.
First the schematic was drawn using the
schematics program

With the AC source set to an amplitude of one volt, the output
voltage will equal the gain. We were able to double click on the
output node wire and name the output node to "out".

From the analysis pulldown menu select "setup". In the analysis
setup menu that comes up select "AC SWEEP" as shown below.
Click on the AC Sweep button.

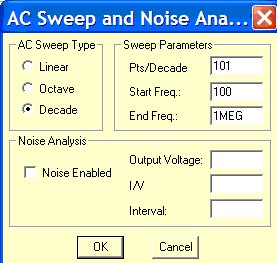
In the AC SWEEP window choose decade and the start, and end
values as shown.

Run the simulation by selecting "simulate" in the analysis pull down menu. The probe window came up. I selected V(out) using the trace pulldown menu.
Trace > Add TraceV(out) was selected for the trace.
Change the Y axis to a logarithmic axis;
Plot > Axis Settings > LogThe output voltage as a function of frequency was displayed as shown below. The horizontal axis is frequency. The corner frequency for this first order low-pass filter is 1.59 KHz.

The PSPICE input file contains the line that produces the frequency sweep,
.ac DEC 101 100 1MEGPSPICE did a frequency sweep with 101 points per decade from 100Hz to 1 MHz
** Analysis setup **
.ac DEC 101 100 1MEG

* From [SCHEMATICS NETLIST] section of msim.ini:
.lib nom.lib
.lib "nom.lib"

* Schematics Netlist *

R_R1         $N_0001 out  10k
C_C1         0 out  10n
V_V1         $N_0001 0 DC 0V AC 1V

.probe

.END
View the SPICE ascii output.