University Physics
Electromagnetics Lab


Figure 1  


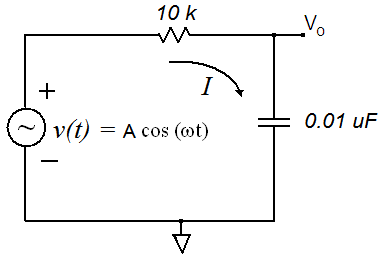
Figure 2   The Function Generator provides source voltage V. The oscilloscope displays the input and output voltages,


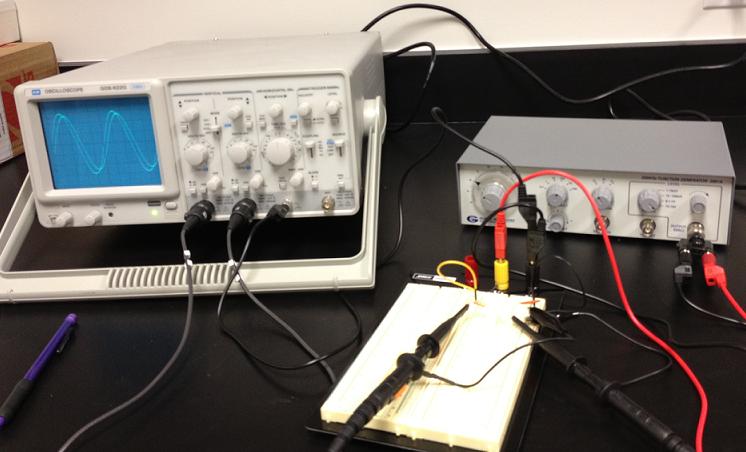
Figure 3   The oscilloscope, Function Generator and circuit board are shown,


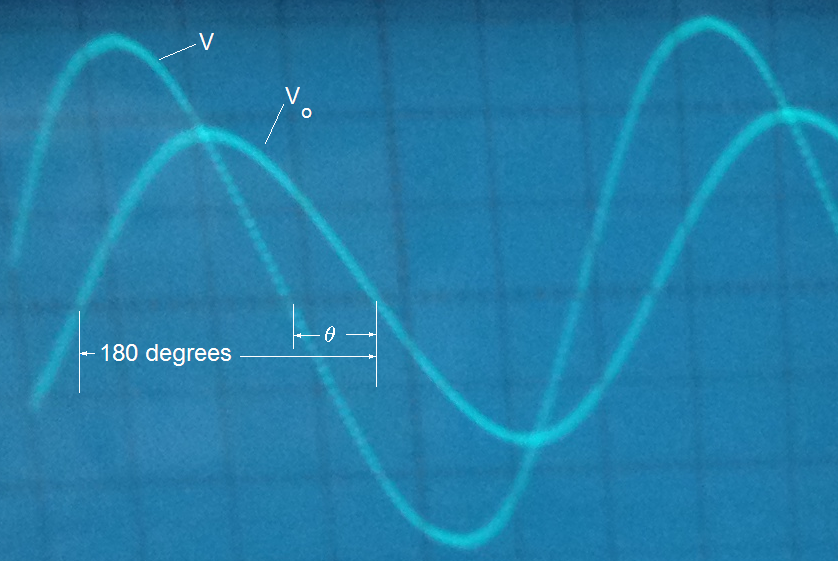
Figure 4   The oscilloscope displays the input voltage, V, and the output voltage, Vo. The output is delayed by q degrees. For the case shown q  is about 60o.

Lab 7     AC Circuits

In this lab, we investigate the frequency response of the circuit shown in Figure 1. The circuit is energized by a sinusoidal voltage v(t). The output voltage is Vo, the voltage across the capacitor. The circuit forms a low-pass filter. Low frequency signals propagate through it. High frequencies are attenuated. This is caused by the frequency sensitivity of the capacitor.

The current through a capacitor is proportional to the time derivative of the voltage.

(1)
The phasor version of Equation 1 is,
(2)
Summing the phasor voltages around the loop in Figure 1 yields,
(3)
Solving for the current,
(4)
Using the current in Equation 4, we can find the voltage across the capacitor.

(5)
The magnitude of the voltage across the capacitor is,
(6)
The phase of Vo relative the voltage source, V  is,
(7)

Equipment

  1. Oscilloscope
  2. Function Generator
  3. Circuit board
  4. An AC voltmeter
  5. 0.01 uF capacitor and a 10 kilohm resistor
  6. Banana connecting leads
Procedure

  1. Wire up the circuit as shown in Figures 2 and 3.
  2. Set up the Function Generator on the 1V - 10V scale, sinusoidal function, and 100 frequency multiplier.
  3. Connect the input voltage, V, to the oscilloscope channel 1 input.
  4. Connect the output voltage, Vo, to the oscilloscope channel 2 input.
  5. Press the GND button to zero each input and set the zero vertical position to the line at the center of the screen.
  6. Set the input voltage to a reasonable value. Note that the oscilloscope probes reduce the signal by a factor of 10. The oscilloscope sees 1/10 of the actual voltage.
  7. Set the vertical controls to dual and chop. With chop both signals are displayed at the same time by alternating pixels from each signal.

    Measure

    • the amplitudes of the input and output voltages.
    • the phase delay of the output relative to the input signal.
    • the period. This allows the frequency to be calculated.
    • Vary the frequency from about 100 Hz to 10,000 Hz . Take data at about 4 frequencies in each decade. Start at 10,000 Hz and increase the period by a factor of 1.5 each time to change the frequency.

    Plot on the attached semi log paper,

    • The ratio of the output amplitude to the input amplitude in dB. Recall,
      (8)
    • The phase shift introduced by the circuit.

    Use the logarithmic axis for frequency.

    STEP
    FIVE
    [Reflect]

    Reflect upon your observations.

    Q: Does the circuit pass low frequencies and attenuate high frequencies?
    Q: Is the output inversely proportional to frequency at high frequencies as predicted by Equation 5?