
In addition to the technique shown here, you can also enter functions of s algebraically into MATLAB.
Consider the following transfer function.
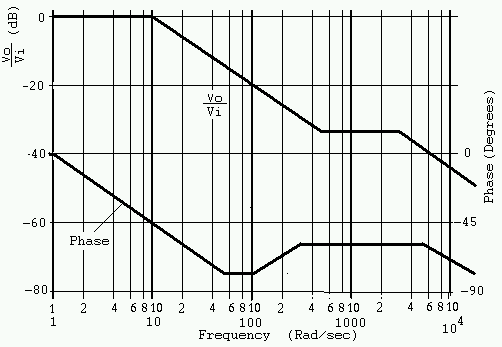
It has a pole at 10 rad/sec and at 3000 rad/sec. These poles cause the magnitude (given in dB) to break toward lower values at these frequencies. There is also a zero at 500 rad/sec. The magnitude breaks upward at the zero.
Each pole or zero term introduces phase. Poles, because they are in the denominator, introduce negative phase. Zeros introduce positive phase. Consider the pole at wp=10 rad/sec. At low frequencies (less than wp/10) its phase is zero. At high frequencies (greater than 10wp) it introduces -90 degrees. At w = wp the pole introduces -45 degrees. The phase can be approximated by 0 for w less than wp/10, a straight line from 0 at wp/10 to -90 at 10wp, and -90 for w greater than 10wp. Actually the phase is -tan-1(w/wp). The straight line approximations for the two poles and the zero add to give the total phase. Poles contribute negative phase. Zeros contribute positive phase.

MATLAB Produces an Exact Plot
Start MATLAB. MATLAB runs on the department's computers. Since you use it in your courses, you can have a free version to run on your PC at home.
Just one line is needed to generate a Bode plot using MATLAB. In the matlab command window type,
>> bode([.2e-2 1], [.333e-4 0.1 1]);The grids are optional.
>> grid
>> grid
These commands produce the Bode plot shown in Figure 2
If we let jw = s, the numerator of the transfer function is,
s/500 + 1 = .002s + 1The MATLAB vector [.2e-2 1] represents the coefficients of the numerator.
After multiplying out the two terms in the denominator and letting jw=s,
(1+jw/10)(1+jw/3000) = 0.333e-4 s2 + 0.1s + 1The MATLAB vector [.333e-4 0.1 1] represents the coefficients of the denominator.
More terms can be added to the vectors to represent any arbitrary polynominal transfer function.
