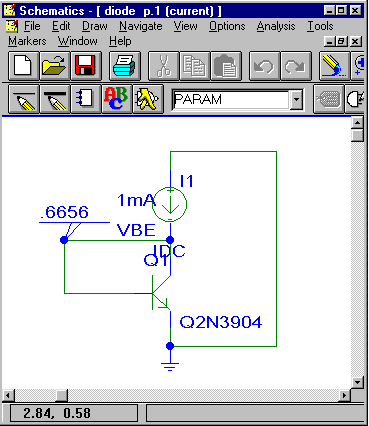

It is important to be able to simulate circuits over a range of temperatures. Here a diode connected transistor is simulated over a temperature range from -25 to 125 degrees C in order to determine how Vbe varies with temperature.
First the schematic was drawn using the
schematics program

A transistor with its base connected to its collector acts like a diode. This configuration is called a "diode connected" transistor.
From the analysis pulldown menu select "setup". In the analysis setup menu that comes up select "DC SWEEP" as shown below.

In the DC SWEEP window choose temperature and the start, end and
increment values as shown.

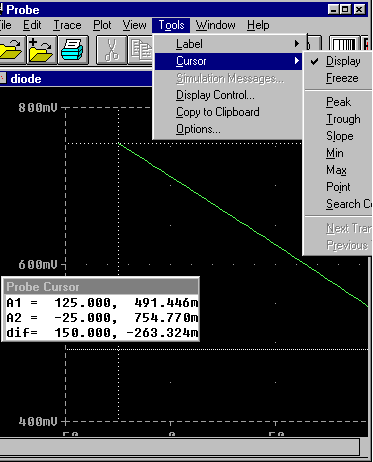
Run the simulation by selecting "simulate" in the analysis pull down menu. The probe window came up. I selected V(VBE) using the trace pulldown menu. Vbe as a function of temperature was displayed as shown below. The horizontal axis is temperature, the vertical is the node voltage V(VBE). To find the slope of the curve, I used the cursors. Select "CURSOR" in the tools pulldown menu. The cursors will be displayed. Position the two sets of cursors at two different points on the curve by dragging one set using the left mouse button. The cursor moves along the curve. Cursor positions are shown in the small window.
The Vbe goes from 0.75V at -25 oC to 0.49V at 125 oC.
That represents an average change of -1.75 mV per degree C.

The PSPICE input file shown below contains the line that produces the
temperature sweep,
.DC LIN TEMP -25 125 2PSPICE did a linear temperature sweep from -25 oC to 125 oC in 2 degree increments.
** Analysis setup **
.DC LIN TEMP -25 125 2
.OP

* From [SCHEMATICS NETLIST] section of msim.ini:
.lib nom.lib
.lib "nom.lib"

* Schematics Netlist *

Q_Q1         VBE VBE 0 Q2N3904
I_I1         0 VBE DC 1mA

.probe

.END