Table 1

|
Table 1 |
Lab 3 Exercise
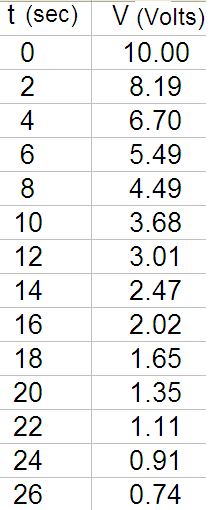
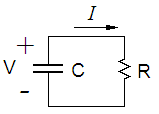
Table 1 contains measured values of the voltage across a capacitor and a resistor wired in parallel. The initial 10 volts decays as current flows from the capacitor. The voltage is an exponential function of time.
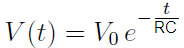
where RC is the time constant.
Recall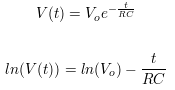
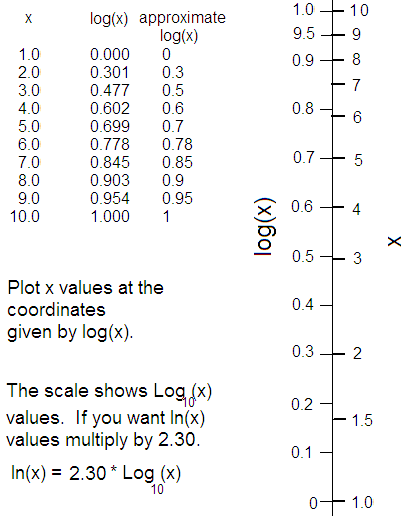
You can draw semi-log paper on linear graph paper using this data.